Challenge description
I just happened to stumble uppon a CD that had stayed in my Dreamcast.
FCSC2021 is written on it. I thought it would be useful to you. As sending
the CD through postal service would not be practical, I am giving to you
instead a DiscJuggler image of the CD. Good luck !
For this challenge, we are given a single Stars2ndMix_CryptoEdition.cdi
disc image.
Now that we have the code, let’s get to reverse-engineering it properly.
The first step is being able to do static analysis. The Dreamcast main
CPU is a Hitachi SH7750 using the SuperH4 ISA. This ISA is supported
by most common disassemblers such as Ghidra, IDA and
r2/Cutter (but not Binary Ninja :( ). I settled on using Ghidra as
it provides a decompiler for the architecture out of the box.
The second aspect is dynamic analysis. Although static analysis is fun, when
analysing an unfamiliar architecture it is always preferable to be able to
query and manipulate the CPU state. Unfortunately, most emulator projects do not
seem to provide usable debugging interfaces out of the box, which is a true pain
for reverse-engineering. Some of them, such as Redream, do provide a gdb stub
for debugging.. but not clearly documented. Others, such as Reicast, do provide
a separate debugger … but without some features (the cpu debugging is not
implemented in reidbg).
In the end I settled on using Reicast because it is open source and easily
buildable. By adding custom code in the CPU emulation loop , we can get
complete control over the CPU and its state. It can be used to produce execution
traces or dump some memory regions, which can come in handy as you will see later on.
Getting the code
The first step is to extract the game code from the cdi file. To do this I used
the GDRom Explorer tool, which can be executed with wine:
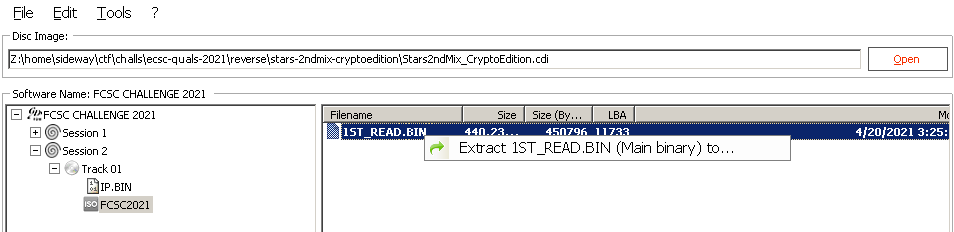
The 1ST_READ.BIN file contains the game code. However it cannot be directly
analysed. The Dreamcast implements a software protection measure called scrambling.
The 1ST_READ.BIN file we extracted is completly scrambled and needs to be unscrambled
before analysis (more details can be found on Fabien Sanglard’s blog here). To unscramble the game we can use the scramble tool in the KallistiOS os
repository here:
https://github.com/KallistiOS/KallistiOS/tree/master/utils/scramble
Simply give the 1ST_READ.BIN to the scramble program as follows to get an unscrambled
version:
$ scramble -d 1ST_READ.BIN unscrambled.bin
Analysis of the game binary
Loading the binary
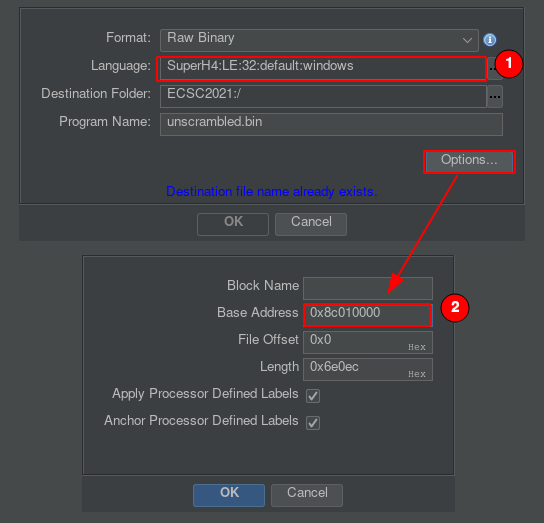
Now that we have a correct binary we can start analysing it. If we follow the documentation
about the Dreamcast boot process, we known that the base address for the binary is 0x8c010000.
Let’s load it in Ghidra:
Then we can launch the Ghidra analysis and wait for it to complete (note: you may have to
stop it midway as it tends to get stuck on some big function).
Debugging: Ghetto mode
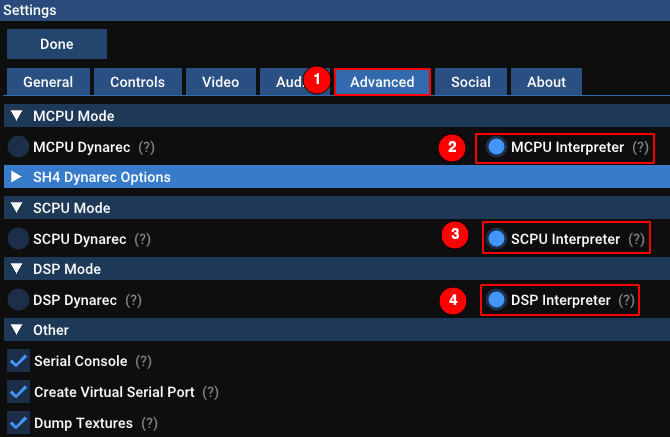
Reicast does not have any CPU debugger. But as it is open source we can quickly build our own.
The emulator uses dynamic recompilation by default, the first step is disabling this (as it
is not easily hookable). To do this we check “interpreter” for everything in the “Advanced” option
tab:
The CPU interpreter loop is inside the libswirl/hw/sh4/interpr/sh4_interpreter.cpp file. An
easily hookable place is the ExecuteOpcode function. Printing the state for a select range of
instruction is as easy as follows:
// Helper code
void dump_context()
{
    std::printf("0x%08x", curr_pc);

    for (unsigned i = 0; i < 16; i++)
        std::printf(" r%u = 0x%08x", i, r[i]);

    std::printf("\n");
}

void ExecuteOpcode(u16 op)
{
	if (sr.FD == 1 && OpDesc[op]->IsFloatingPoint())
		RaiseFPUDisableException();

	// Actual hook
    	if ((curr_pc >= <low bound> && curr_pc < <high bound>))
    	    dump_context();

	OpPtr[op](op);
}
Try to trace as little as possible or you may encounter some issues …

Finding the target
A good way to find the checking code is to look for the classic “good boy” and “bad boy”
basic blocks. As per usual, we look for what should be printed on the screen after the check.
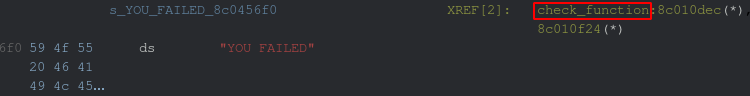
For this game we look for the “YOU FAILED” string:

Ghidra quickly finds a reference.
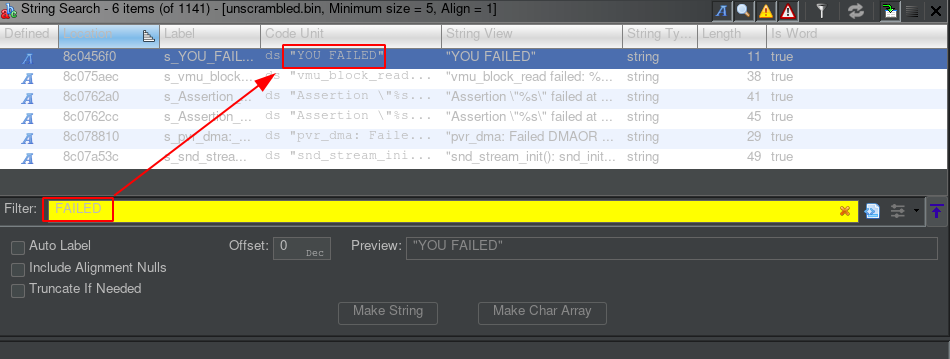
This string is referenced in the check_function at address 0x8c010d90.
The checking function is quite big and the decompilation pretty cryptic. By looking around
we can find a few interesting pieces of code. The first one starts near the beginning of the
functions.
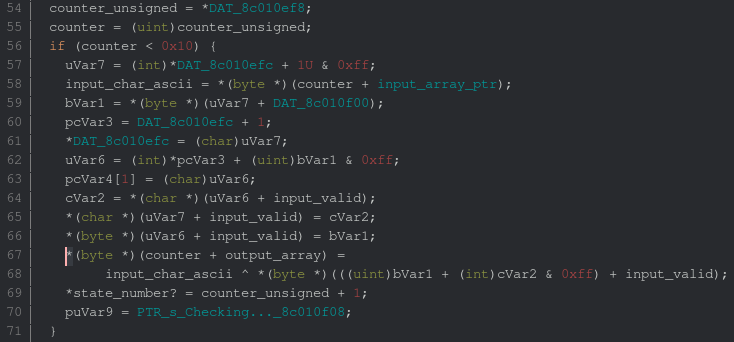
All around the function, the counter variable is used. The fact that our input is exactly
16 bytes and the operations used by this piece of code make it pretty suspicious. We can check that
this manipulates our input by taking an execution trace of the code between addresses 0x8c010dae
and 8c010de8. We use as an input AAAABBBBCCCCDDDD to get something recognisable. From the
following (simplified) execution trace we retrieve our input in the r5 register:
0x8c010db8 r0 = 0x00000000 [...] r5 = 0x00000041 r6 = 0x8c07e25d [...]
0x8c010db8 r0 = 0x00000001 [...] r5 = 0x00000041 r6 = 0x8c07e25d [...]
0x8c010db8 r0 = 0x00000002 [...] r5 = 0x00000041 r6 = 0x8c07e25d [...]
0x8c010db8 r0 = 0x00000003 [...] r5 = 0x00000041 r6 = 0x8c07e25d [...]
0x8c010db8 r0 = 0x00000004 [...] r5 = 0x00000042 r6 = 0x8c07e25d [...]
0x8c010db8 r0 = 0x00000005 [...] r5 = 0x00000042 r6 = 0x8c07e25d [...]
0x8c010db8 r0 = 0x00000006 [...] r5 = 0x00000042 r6 = 0x8c07e25d [...]
0x8c010db8 r0 = 0x00000007 [...] r5 = 0x00000042 r6 = 0x8c07e25d [...]
0x8c010db8 r0 = 0x00000008 [...] r5 = 0x00000043 r6 = 0x8c07e25d [...]
0x8c010db8 r0 = 0x00000009 [...] r5 = 0x00000043 r6 = 0x8c07e25d [...]
0x8c010db8 r0 = 0x0000000a [...] r5 = 0x00000043 r6 = 0x8c07e25d [...]
0x8c010db8 r0 = 0x0000000b [...] r5 = 0x00000043 r6 = 0x8c07e25d [...]
0x8c010db8 r0 = 0x0000000c [...] r5 = 0x00000044 r6 = 0x8c07e25d [...]
0x8c010db8 r0 = 0x0000000d [...] r5 = 0x00000044 r6 = 0x8c07e25d [...]
0x8c010db8 r0 = 0x0000000e [...] r5 = 0x00000044 r6 = 0x8c07e25d [...]
0x8c010db8 r0 = 0x0000000f [...] r5 = 0x00000044 r6 = 0x8c07e25d [...]
The instruction just before this address is:
8c010db6 4c 05 mov.b @(r0,r4)=>DAT_8c07e128,r5
This corresponds to the line 58 in the previous screenshot. At line 68, the input byte is
xored with a combination of other variables. By looking at the registers during the xor
operation, we can get the key our input is xored with. We “breakpoint” at the following
instruction:
And get the following trace:
0x8c010de0 [...] r1 = 0xffffffff [...] r5 = 0x00000041 [...]
0x8c010de0 [...] r1 = 0xffffffd7 [...] r5 = 0x00000041 [...]
0x8c010de0 [...] r1 = 0xffffffa4 [...] r5 = 0x00000041 [...]
0x8c010de0 [...] r1 = 0xffffffda [...] r5 = 0x00000041 [...]
0x8c010de0 [...] r1 = 0xfffffff6 [...] r5 = 0x00000042 [...]
0x8c010de0 [...] r1 = 0xffffffaa [...] r5 = 0x00000042 [...]
0x8c010de0 [...] r1 = 0x00000011 [...] r5 = 0x00000042 [...]
0x8c010de0 [...] r1 = 0x00000037 [...] r5 = 0x00000042 [...]
0x8c010de0 [...] r1 = 0xfffffffd [...] r5 = 0x00000043 [...]
0x8c010de0 [...] r1 = 0xffffffc3 [...] r5 = 0x00000043 [...]
0x8c010de0 [...] r1 = 0xffffffda [...] r5 = 0x00000043 [...]
0x8c010de0 [...] r1 = 0x0000006c [...] r5 = 0x00000043 [...]
0x8c010de0 [...] r1 = 0xffffffa3 [...] r5 = 0x00000044 [...]
0x8c010de0 [...] r1 = 0x00000029 [...] r5 = 0x00000044 [...]
0x8c010de0 [...] r1 = 0xffffffda [...] r5 = 0x00000044 [...]
0x8c010de0 [...] r1 = 0xffffff98 [...] r5 = 0x00000044 [...]
By testing multiple times with different input, we can confirm that the key is constant and
does not depend on the input. The extracted xor key is thus:
xor_key = [
        0xff, 0xd7, 0xa4, 0xda,
        0xf6, 0xaa, 0x11, 0x37,
        0xfd, 0xc3, 0xda, 0x6c,
        0xa3, 0x29, 0xda, 0x98
]
By scrolling around the function code, we encounter another very suspicious construct.
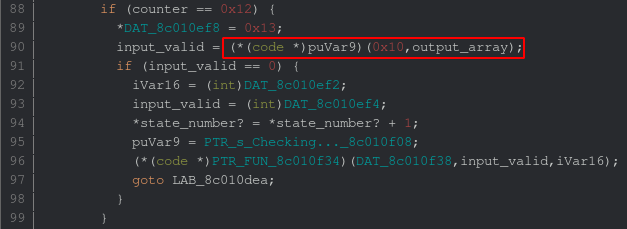
The function 8c0110b4 is called with a 0x10 as first argument (flag size) and the xored
input array (here Ghidra displays puVar9 because it has trouble resolving the indirect
calls in SH4, you can see the function address in the disassembly listing). The return
value of this function is then compared against 0.
Let’s take a look at the potential flag checking function:
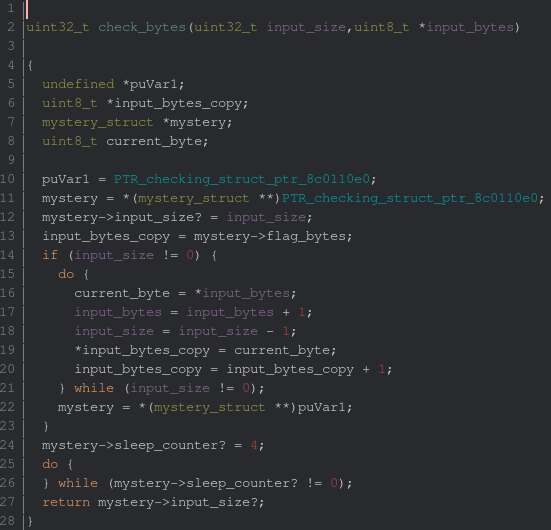
From a very quick glance this function seems extremely weird. The input size is stored in
a mysterious structure. The encrypted input is copied into this structure (the do/while loop
from line 16 to 21). Then a counter is set to 4 just before looping indefinitely on a seemingly
always true condition (????).
At first I was surprised by this function because its behavior seemed nonsensical. From the
execution traces, I could notice that after a while the sleep_counter would mysteriously be
set to 0 and the function would exit with 0x7f. And as we saw, the hypothetical correct
return value for this function should be zero.
There were two possible explanations to this behavior. The first one would be threading. From
taking a look at the KallistiOS source code, we see that a threading system is implemented.
This could match as the code from lines 24 to 27 closely ressembles a spinlock.
I spent a lot of time digging through traces, thinking that somehow my hooks in the emulator
were magically broken during IRQs (and thus task switching). In the end I ditched this hypothesis
and took a step back.
By digging through the documentation and scrolling through traces I got an idea explaining the
curious phenomenon. While the dreamcast relies on the SH4 cpu for common tasks, it also uses
specialised hardware for others, such as the NEC PowerVR2 GPU for graphics and the Yamaha AICA
for sound processing. The instruction loading the sleep_counter in the spinlock is the following:
8c0110d4 22 51 mov.l @(r2, 0x8), r1
The register state at this address is:
0x8c0110d4 [...] r1 = 0x00000004 r2 = 0xa080ff00 [...]
The 4 in r1 is expected (as it is the value set at line 24), but the structure address in r2 is
more peculiar. If we look for the constant 0xa0800000 in the KallistiOS code we find out
that this address is inside the Yamaha AICA SPU’s memory (kernel/arch/dreamcast/sound/snd_iface.c).
What this piece code does is sending commands to the SPU ! From a cursory glance, the main CPU
places the command id in the sleep_counter? field of the mysterious structure. The size of the
argument in input_size?. Then the command argument in the flag_bytes field. It then waits
for the SPU to finish processing the command. When the command reaches completion, the SPU
sets the input_size? as the return value of the call, and signals the completion by setting
sleep_counter? to 0, making the CPU exit its loop.
It explains why values mysteriously changed and why the CPU trace did not show anything ! All of
this is possible as the SPU code/firmware is loaded by the main CPU. Anyone is free to upload whatever
code they want to run on it. The SPU’s firmware can easily be dumped for analysis by placing the
following code in the ExecuteOpcode function, as we did for getting the execution trace:
if (curr_pc == 0x8c0110d2)
{
    // Let's dump the spu ram
    std::vector<u8> arm_code;

    for (unsigned i = 0; i < 0x10000; i++)
        arm_code.push_back(ReadMem8(0xa0800000 + i));

    FILE* fp = fopen("spu.bin", "wb");
    fwrite(arm_code.data(), 1, arm_code.size(), fp);
    fclose(fp);
}
Analysis of the SPU’s firmware
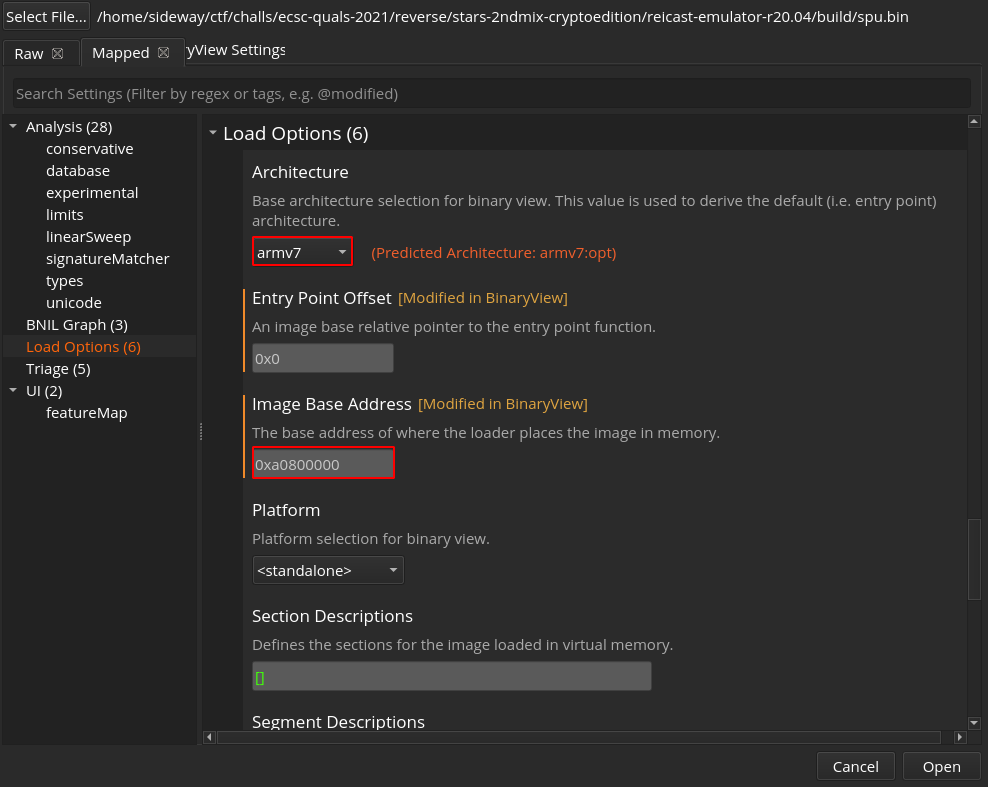
The firmware can be loaded using the Open with options... of Binary Ninja (I used the SPU memory
mapping as the base, but I am unsure about this, oh well …):
Now that binja is analysing. We need a way of isolating which piece of code loads the encrypted
flag bytes. Remember when I said “don’t trace everything” ? Well this is exactly what I did. In
the ARM emulation code inside libswirl/hw/arm7/arm7.cpp, I added the following code to the
ARM7Backend::Step function:
u32 DYNACALL ARM7Backend::Step(Arm7Context* ctx) {
	u32 clockTicks = 0;

	if (reg[INTR_PEND].I)
	{
		CPUFiq(ctx);
	}

	/// start logging code
    	std::printf("ARM:0x%08x ", reg[15]);

    	for (unsigned i = 0; i < 16; i++)
        	std::printf("r%u = 0x%08x ", i, reg[i]);

    	std::printf("\n");
	/// end logging code

	reg[15].I = armNextPC + 8;

	#include "gpl/vba-arm/arm-new.h"

	return clockTicks;
}
This modification almost makes the emulator grind to a halt. The goal is to reach the “YOU FAILED” as
quickly as possible by mashing the touchpad. Once the screen is reached we get the following
wonderful trace:
$ ls -lh full_trace.txt
-rw-r--r-- 1 sideway sideway 7.2G May  2 23:05 full_trace.txt
From looking at the last few lines of the trace, we can get a few information. The ARM cpu sees
the memory at 0xa0800000 (from the main CPU PoV) as if it were 0. We know that the structure
containing the main CPU command lies at 0xa080ff00. As the input buffer is at offset 0x10
from the beginning of this structure, we can guess that from the SPU’s PoV the encrypted flag
bytes start at address 0x0000ff10.
Trying to grep the trace by relying solely on this information will give too many results. To
narrow down on the wanted piece of code we can use the fact that we know the encrypted bytes
for a given input. If the input is all zeroes, we get 0x30 ^ 0xff = 0xcf for the first byte,
0x30 ^ 0xd7 = 0xe7 for the second, so on and so forth.
$ grep "0x0000ff10 " full_trace.txt | grep "cf " # Grep for first flag byte address + encrypted value of first 0
ARM:0x00001fec [...] r2 = 0x0000ff10 [...] r14 = 0x000000cf
ARM:0x00001ff0 [...] r2 = 0x0000ff10 [...] r14 = 0x000000cf
ARM:0x00001ff4 [...] r2 = 0x0000ff10 [...] r14 = 0x000000cf
ARM:0x00001ff8 [...] r2 = 0x0000ff10 [...] r14 = 0x000000cf
ARM:0x00001ffc [...] r2 = 0x0000ff10 [...] r14 = 0x000000cf
ARM:0x00001fe8 [...] r2 = 0x0000ff10 [...] r14 = 0x000000cf

$ grep "0x0000ff11 " full_trace.txt | grep "e7 " # Grep for second flag byte address + encrypted value of second 0
ARM:0x00001fec [...] r2 = 0x0000ff11 [...] r14 = 0x000000e7
ARM:0x00001ff0 [...] r2 = 0x0000ff11 [...] r14 = 0x000000e7
ARM:0x00001ff4 [...] r2 = 0x0000ff11 [...] r14 = 0x000000e7
ARM:0x00001ff8 [...] r2 = 0x0000ff11 [...] r14 = 0x000000e7
ARM:0x00001ffc [...] r2 = 0x0000ff11 [...] r14 = 0x000000e7
ARM:0x00001fe8 [...] r2 = 0x0000ff11 [...] r14 = 0x000000e7
We quickly notice that the first two bytes are loaded from the same piece of code and nowhere else.
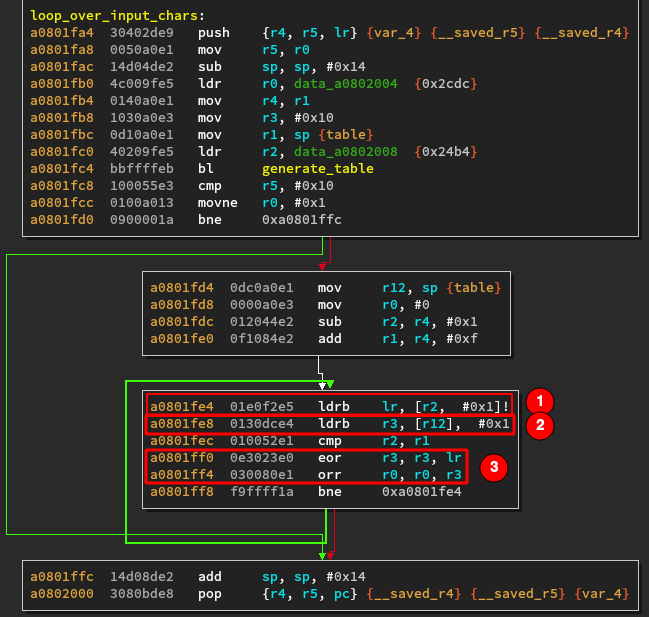
We know from the input that r14 contains the encrypted flag byte. It means that the instruction at (1)
is the one loading the byte (lr is an alias for r14 in ARM). The instruction (2) loads a byte
from somewhere. In the last block of instructions (3), the flag byte is xored with the value
from the unknown array and the result is orred with r0. This series of instruction is repeated for
each input byte.
r0 in ARM contains the return value of a function. Let’s see what this function returns:
$ grep "ARM:0x00002000" full_trace.txt
ARM:0x00002000 r0 = 0x0000007f [...]
This function returns 0x7f, which is exactly the return value we got on the main CPU side !
To get 0 as a result we need to make sure that the xored bytes from our flag are equal to
the ones coming from the unknown array. Fortunately, we can juste grep for them in the trace:
$ grep "ARM:0x00001ff0" full_trace.txt
ARM:0x00001ff0 [...] r3 = 0x000000cd [...]
ARM:0x00001ff0 [...] r3 = 0x000000e3 [...]
ARM:0x00001ff0 [...] r3 = 0x000000e5 [...]
ARM:0x00001ff0 [...] r3 = 0x000000eb [...]
ARM:0x00001ff0 [...] r3 = 0x000000b7 [...]
ARM:0x00001ff0 [...] r3 = 0x00000092 [...]
ARM:0x00001ff0 [...] r3 = 0x00000025 [...]
ARM:0x00001ff0 [...] r3 = 0x00000005 [...]
ARM:0x00001ff0 [...] r3 = 0x000000cd [...]
ARM:0x00001ff0 [...] r3 = 0x000000f1 [...]
ARM:0x00001ff0 [...] r3 = 0x000000ea [...]
ARM:0x00001ff0 [...] r3 = 0x0000005c [...]
ARM:0x00001ff0 [...] r3 = 0x00000090 [...]
ARM:0x00001ff0 [...] r3 = 0x0000006a [...]
ARM:0x00001ff0 [...] r3 = 0x000000e9 [...]
ARM:0x00001ff0 [...] r3 = 0x000000af [...]
By xoring the expected bytes with the constant xor key we get the flag:
expected_bytes = [
    0xcd, 0xe3, 0xe5, 0xeb,
    0xb7, 0x92, 0x25, 0x05,
    0xcd, 0xf1, 0xea, 0x5c,
    0x90, 0x6a, 0xe9, 0xaf,
]

xor_key = [
    0xff, 0xd7, 0xa4, 0xda,
    0xf6, 0xaa, 0x11, 0x37,
    0xfd, 0xc3, 0xda, 0x6c,
    0xa3, 0x29, 0xda, 0x98
]

print("FCSC{" + "".join(chr(a ^ b) for a, b in zip(expected_bytes, xor_key)) + "}")
This prints FCSC{24A1A84202003C37}. And of course, we can enter it inside the game to get the
success message:

Afterword
Having done some reverse-engineering on retro consoles previously (GBA), I was really happy
to be able to play around with a new architecture. These old platforms really force you to
go out of your comfort zone and make you go back to the basics. Not having your usual tools
forces you to get creative and explore other reverse-engineering approaches (like using execution
traces). It was also a good idea to introduce this asynchronous behavior between the main CPU and
SPU. All too often reverse-engineering challenges are too serial in nature. Having some kind of multithreading
was really refreshing to see !
Overall, I really liked this challenge (apart from setting up a good debugging environment, which was a PITA)
and would like to see more exotic architectures in the future !